

RGB - VNIR data, 15 m resolution. Ash rich plume evident along with thermal signal from flow. Note deposits down the NW flanks. Zoomed in view below.


TIR data, ASTER band 10 at 8.29 um. Lava flow and plume evident. Zoomed in on flow.
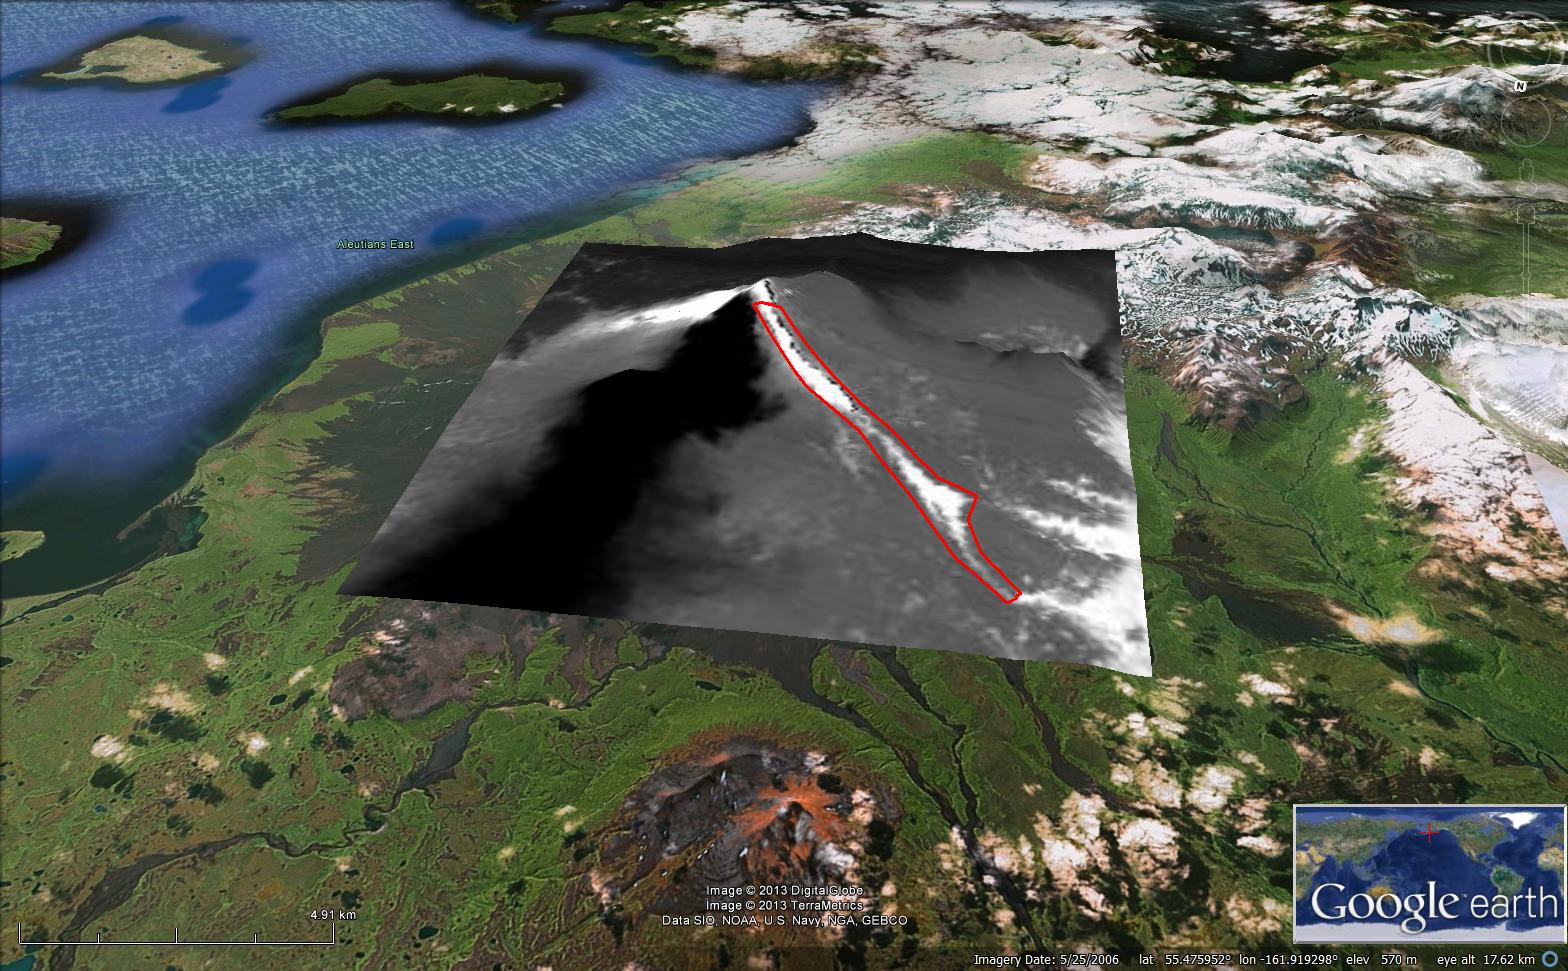
TIR data overlayed in Google Earth. Red polygon represents area with elevated temperature. Hottest portion close to the summit. In TIR wavelengths = 100 C, portion on the flanks at around 20 C in TIR wavelengths.

VNIR data in Google Earth, with red polygon from TIR analysis. Note that the elevated temperature seen in TIR on the lower flanks are co-located with the darker RGB feature, likely from the eruptive activity. Highlighted by black circle.
----------------------
Peter Webley
Geophysical Institute
University of Alaska Fairbanks
Fairbanks Alaska
USA.
99775
email: pwebley@gmail.com
----------------------


No comments:
Post a Comment